Introduction
Deep-learning and radiomics are promising approaches to improve the clinical management of non-small cell lung cancer (NSCLC). We aimed to assess the prognostic role of combined use of deep-learning and radiomics in NSCLC patients.
Deep-learning and radiomics are promising approaches to improve the clinical management of non-small cell lung cancer (NSCLC). We aimed to assess the prognostic role of combined use of deep-learning and radiomics in NSCLC patients.
Methods
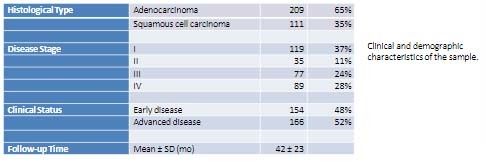
320 NSCLC patients that underwent PET/CT with FDG were divided into an early stage group (n=154) and advanced stage (n=166). A total of 48 predictors including 43 texture, 3 shape-features, SUVmax and MTV were extracted from PET studies. Least absolute shrinkage and selection operator (LASSO) regression was used to select features with highest predictive value. Selected variables were given as input to a feed-forward neural multi-layer network (FNN). Area under the curve (AUC) was used to assess diagnostic performance.
320 NSCLC patients that underwent PET/CT with FDG were divided into an early stage group (n=154) and advanced stage (n=166). A total of 48 predictors including 43 texture, 3 shape-features, SUVmax and MTV were extracted from PET studies. Least absolute shrinkage and selection operator (LASSO) regression was used to select features with highest predictive value. Selected variables were given as input to a feed-forward neural multi-layer network (FNN). Area under the curve (AUC) was used to assess diagnostic performance.
Table 1
Results
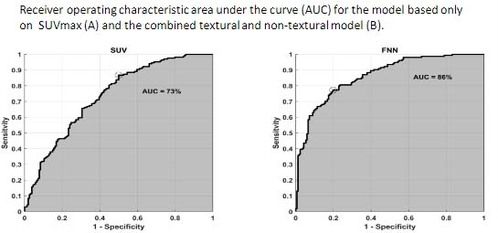
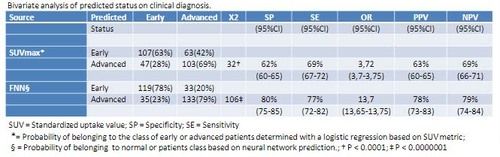
Twelve variables including 10 textures features, SUVmax and MTV showed highest predictive value at LASSO regression analysis. FNN prediction of disease stage based on selected features provide a more significant patients stratification as compared to SUV-based prediction. FNN coupled with radiomic plus SUV-based features distinguished the two groups better than SUVmax alone (FNN AUC (95% CI); 86.28% (88.03-86.52) vs. SUV AUC (95% CI); 73.3% (72.98-73.72) (P=0.0058). The difference in progression-free survival (HR FNN vs. SUV; 2.01 vs. 1.78) and overall survival (HR FNN vs. SUV; 2.31 vs. 1.84) between the two groups was also significantly greater when calculated with the FNN model compared to SUVmax alone.
Twelve variables including 10 textures features, SUVmax and MTV showed highest predictive value at LASSO regression analysis. FNN prediction of disease stage based on selected features provide a more significant patients stratification as compared to SUV-based prediction. FNN coupled with radiomic plus SUV-based features distinguished the two groups better than SUVmax alone (FNN AUC (95% CI); 86.28% (88.03-86.52) vs. SUV AUC (95% CI); 73.3% (72.98-73.72) (P=0.0058). The difference in progression-free survival (HR FNN vs. SUV; 2.01 vs. 1.78) and overall survival (HR FNN vs. SUV; 2.31 vs. 1.84) between the two groups was also significantly greater when calculated with the FNN model compared to SUVmax alone.
Table 2
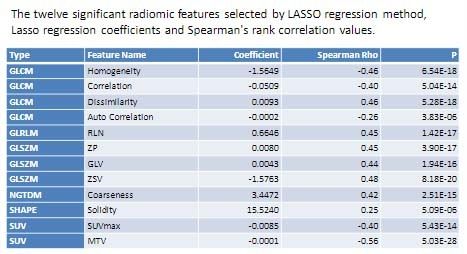
Figure 1
CONCLUSION
These data indicate that FNN and mixed model including radiomic features and SUV metric can aid in the distinction between early stage and advanced stage NSCLC patients and can be used to predict survival in NSCLC with greater statistical power than SUVmax alone
These data indicate that FNN and mixed model including radiomic features and SUV metric can aid in the distinction between early stage and advanced stage NSCLC patients and can be used to predict survival in NSCLC with greater statistical power than SUVmax alone
Figure 2
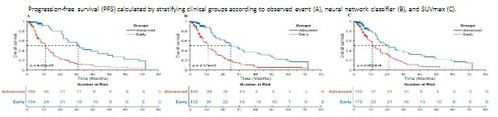
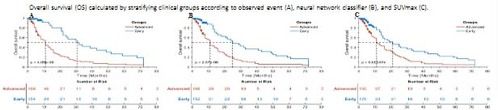
Table 3
REFERENCES
?
?
The data in this poster was presented at ESMO 2021. Published with permission from the Copyright owner.